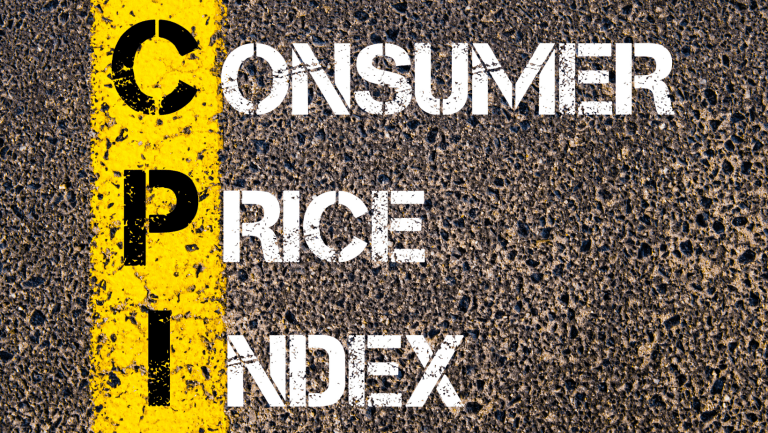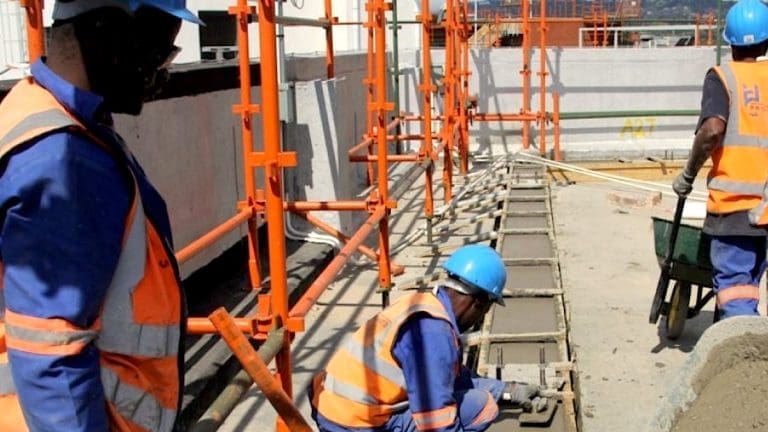
In a recent report released by Statistics South Africa (Stats SA), it has been revealed that the annual consumer price inflation in July 2023 stood at 4.7%, marking a notable decrease from the 5.4% inflation rate recorded in June 2023. This data sheds light on the economic dynamics within the nation, providing insights into the fluctuating costs of living for urban consumers. As the nation’s economy grapples with various challenges, understanding the nuances of these inflation figures becomes imperative for both policymakers and everyday citizens.
A Dip in the Numbers: Unraveling the Inflation Trend
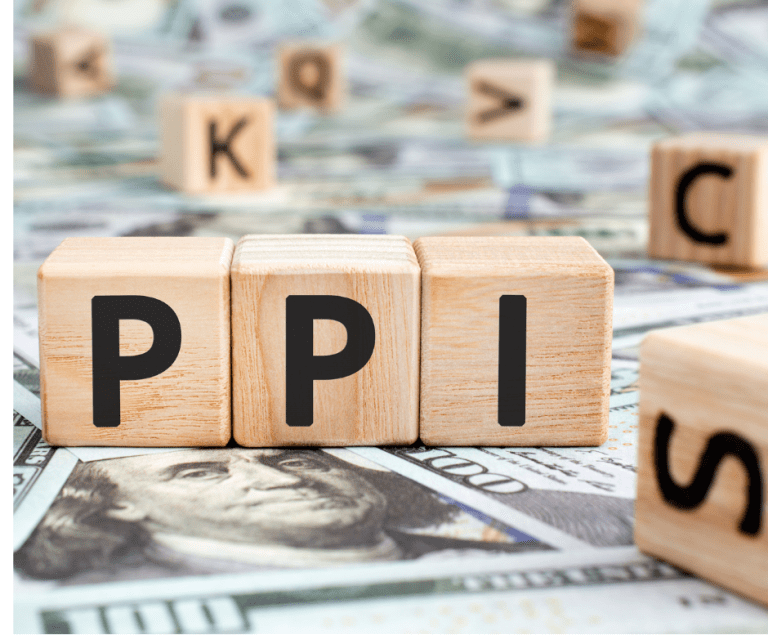
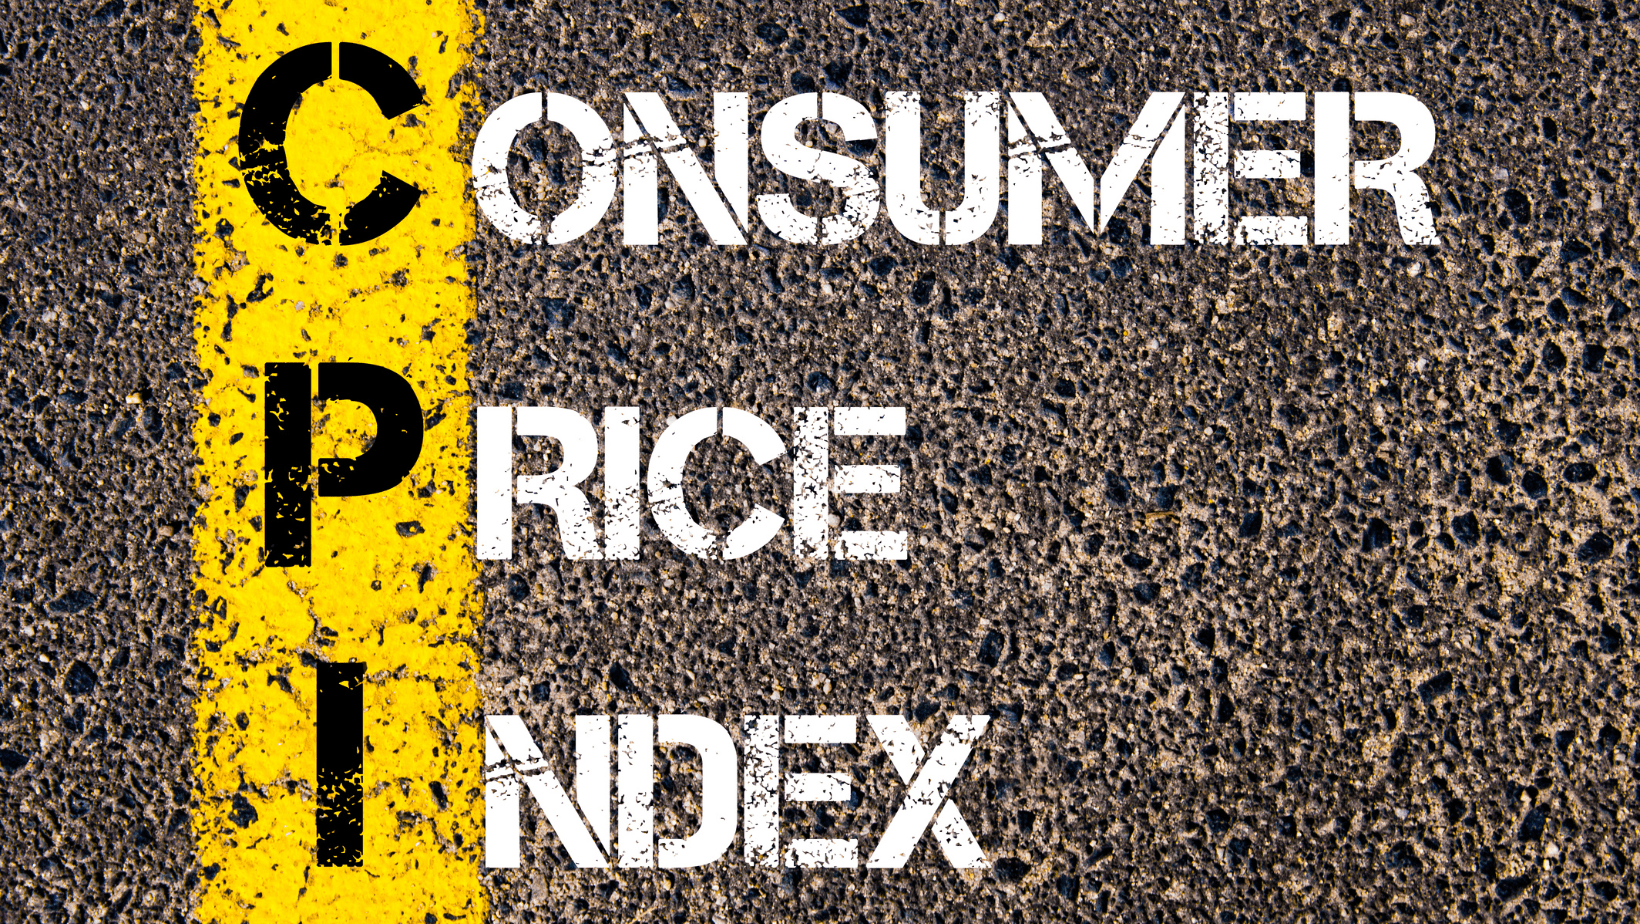
The Consumer Price Index (CPI), a key indicator that gauges the average change in prices paid by urban consumers for a specified basket of goods and services, witnessed a modest 0.9% increase from June 2023 to July 2023. However, this increase was notably lower compared to the preceding month.
Noteworthy contributors to the annual inflation rate of 4.7% include food and non-alcoholic beverages, housing and utilities, and miscellaneous goods and services. Food and non-alcoholic beverages saw a substantial year-on-year increase of 9.9%, contributing 1.7 percentage points to the overall inflation figure. Housing and utilities costs increased by 5.1% year-on-year, contributing 1.2 percentage points, while miscellaneous goods and services saw a 6.3% year-on-year increase, contributing 0.9 percentage points to the inflation rate.
Goods and Services: The Tale of the Numbers
The data further highlights the divergent trajectories of goods and services in the market. The annual inflation rate for goods experienced a decline from 6.3% in June to 5.5% in July 2023. Meanwhile, the inflation rate for services registered a marginal decrease from 4.5% in June to 4.0% in July.
Breaking Down the Numbers: A Comprehensive View
The detailed results, as presented in Table A from the Consumer Price Index report, offer a comprehensive view of the inflation landscape:
| Group | Index (Dec 2021=100) | % Change Jul 2022 | Jun 2023 | Jul 2023 | % Change Jul 2023 vs. Jun 2023 | % Change Jul 2023 vs. Jul 2022 |
|---|---|---|---|---|---|---|
| All items (CPI Headline) | 100.00 | 105.8 | 109.8 | 110.8 | 0.9 | 4.7 |
| CPI excluding food and NAB, fuel, energy | 74.40 | 103.4 | 107.8 | 108.3 | 0.5 | 4.7 |
| Trimmed mean | .. | 104.0 | 108.6 | 109.0 | 0.4 | 4.8 |
| … | … | … | … | … | … | … |
Future Projections: An Upcoming Basket Update
In a move to ensure the CPI’s accuracy and relevance, Stats SA will be updating the CPI basket of goods and services, along with their respective weights, in January 2025. This update will primarily be based on the results of the income and expenditure survey, conducted through fieldwork starting from November 2022. As the South African economy evolves, the updated basket will provide a more accurate reflection of the changing consumption patterns and costs faced by citizens.
Implications for the Economy and Households
The CPI serves as a vital economic indicator, influencing various facets of the nation’s economic landscape. From wage negotiations to business decisions, the CPI data holds considerable importance. With the inflation rate easing to 4.7% in July, the pressure on households may alleviate to some extent, allowing consumers more breathing room in managing their budgets.
For policymakers, these figures offer insights into the effectiveness of monetary and fiscal policies in curbing inflationary pressures. The trends observed in food and non-alcoholic beverage costs, housing and utilities, and miscellaneous goods and services underscore the need for targeted measures to ensure affordability and stability in these key sectors.
A Regional Perspective: Varying Inflation Rates
The CPI data doesn’t just offer a national snapshot; it also sheds light on the diverse inflation trends across South Africa’s provinces. Notably, the Western Cape, Eastern Cape, Northern Cape, Free State, KwaZulu-Natal, North West, Gauteng, Mpumalanga, and Limpopo exhibit varying inflation rates, contributing to the intricate economic fabric of the nation.
Conclusion: Navigating South Africa’s Economic Terrain
The July 2023 CPI report reveals a nuanced picture of South Africa’s economic landscape. While the annual inflation rate of 4.7% signals a slight decline from the previous month, the components driving this figure, particularly food, housing, and miscellaneous goods and services, demand careful consideration. As South Africa moves forward, policymakers, businesses, and citizens alike will closely monitor the CPI trends, looking to make informed decisions that promote economic stability and sustainable growth.